Tuesday, October 20, 2015

Lab 6: Using the GEMs software to construct geotiffs, and to field check your GEMs data.

Introduction:

The GEMS (Geo-localization and Mosaicing Sensor) is a multispectral payload designed to be mounted on a flat portion of a small UAV with the cameras facing down. The sensor is capable of  capturing RGB, NIR, and NDVI imagery simultaneously during flight, which allows the data to be used in a larger range of applications one processed.  The sensor has a 1.3MP RGB and MONO camera resolution, and a ground sampling distance (GSD) of 5.1cm at 400ft ad 2.5cm at 200ft.  

The accompanying software (GEMS Tool) is capable of displaying the data as a georeferenced mosaic for the RGB, NIR, or NDVI band spectrums.  The program, however, cannot orthorectify the data because this process, as described by the ArcGIS desktop help, requires the use of a digital elevation model in order to correct distortions due to topographic variation.

Software Procedure:

The GEMS Tool software is provided with the GEMS hardware kit, and is used to produced georeferenced mosaics from data obtained using the sensor. To access the data within program, locate the .bin file within the Flight Data folder on the usb storage drive and load it in the GEMS Tool software. The flight data folder is labeled with using the following format to display the GPS time the data was collected: Week=A TOW=H-M-S.  Upon successful upload, the program immediately translates that data and displays it visually on the screen as the flight path taken during data collection (Photo 1). 
Photo 1 showing the flight path in Lab 4 after loading
 .bin file into the GEMS Tool software. 
 Prior to generating the mosaic, it is important to run the NDVI Initialization tool and allow the program to perform a spectral cross-band alignment.  As seen in photos 3 and 4, the Normalized Difference Vegetation Index is represented in two different color schemes.  The first scheme (Photo 3) represents vegetation as hot colors (orange-red) and non-vegetation as cool colors (green-blue). Photo 4 shows the same data but  reverses the color scheme to provide a more intuitive color map where vegetation is represented as green.


Photo 3: NDVI FC1, displaying vegetation
as orange, and non vegetation as green
Photo 4: NDVI FC1, displaying vegetation 
as green, and non vegetation as red


After the NDVI Initialization process is complete, run the mosaic tool.  For this assignment, we selected the fine alignment option to obtain the best possible results.  This tool will generate a folder with a series of "tiles" for each spectrum band that the mosaic tool generated (Photo 5).


Photo 5: Displaying one tile generated for the RGB spectrum using the mosaic tool.
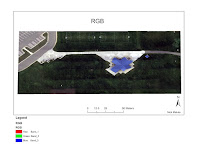
 The overview mosaics, which combine the tiles into a single image, are also found within the tiles folder in the jpeg and .tif file formats. When producing the final maps, the .tif files were used because of their ability to be easily read by GIS tools such as ArcMap.  As supplied below, a final map was produced for NDVI FC1, NDVI FC2, Mono Fine, NDVI Mono Fine, and RGB.  A basemap using world imagery of the location was added for comparison. The software also has the capability to export to Pix4D, which would allow a geographer to then take the data obtained from the GEMS sensor and measure volume extractions or stockpiles in the mining industry.

Photo 6: NDVI FC1- NDVI color scheme indicates
vegetation in orange/red, and non vegetation in green/blue.

Photo 7: Mono Fine- This map displays the raw,
black and white, imagery mosaic of the target area


Photo 8: NDVI FC2- NDVI color scheme indicates vegetation
in green, and non-vegetation in red.  This color scheme is more
intuitive to geographers.  
Photo 9: NDVI Mono Fine-  NDVI Color scheme
indicates white as vegetation, and black as
 non-vegetation.


Photo 11: RGB-  Map showing the colored,
imagery mosaic of the target area.

Photo 10: World Imagery- Basemap of target
area obtained from ESRI ArcMap
GIS 13.4.1 Software


Photography completed at the Eau Claire Soccer Parks,
Eau Claire WI, 54701 on Wednesday September 23rd, 2015
for the purpose of exploring and reviewing the GEMS 
hardware and associated software.


Discussion and Final Opinion
The GEMS Sensor and associated software provides a practical and versatile data analysis package that is relatively easy to use. The individual tiles/photos produced by the sensor are of only low to moderate quality, but were more than sufficient to meet the needs of this assignment.  In the business world, however, it is easy to see how a more advanced sensor with higher resolution may be required. It is appreciated, however, that the NDVI is represented in two different color schemes.  Although it may not be a critical aspect of this assignment, the NDVI FC2 color scheme is more intuitive, and makes it easier to distinguish between the vegetation and non-vegetation within the map area.

 Overall, the mosaic tool did an good job of aligning most of photos together to form the RGB mosaic, which is seen by its comparison with the World Imagery Maps (Photos 10 and 11). However, it is seen in NDVI final mosaic images that the software struggled to align the edges of the tiles.  As result, the final images have large streaks running northeast/southwest across the photo.  It is acknowledged that some discrepancies are unavoidable but for use in the agricultural industry, this might to problems because of the large areas that are smudged by the mosaic tool. 
In conclusion, the GEMS hardware and software combo is user friendly, excels at allowing inexperienced users to producing basic mosaic images.  However, in my opinion, the sensor should receive an upgrade for its 1.3MP camera so that it can begin to compete with other sensors such as the Canon SX260 and the GoPro which have 12.1MP and 12MP cameras, respectively.   I would likely  only use this program again due to its ease of use, and its ability to mosaic photos in a relatively short time.  The NDVI images do have some alignment errors, and would likely not be acceptable in real world applications.  Although the sensor was suitable for the purposes of this lab,  in the world of mining problems in alignment could calculation errors that ultimately cost lives.


Sunday, October 11, 2015

Lab 5:  Obliques for 3D-Model Construction

Introduction:

Nadir photography is utilizes single point perspective, meaning that the photo is taken from a completely vertical position. This perspective allows for the scale to remain relatively constant and therefore make measurements easier than working with oblique photographs.  In comparison, oblique photography is characterized by tilting the camera at an angle between the optical axis and the nadir line.  As a result, the scale varies with the angular orientation in addition to the topographic relief.  Oblique images are useful for providing overviews of an area and easier to distinguish and recognize objects.  For this lab exercise, the focus was capturing oblique images for the purpose of processing them into a 3D-model at a later date.  

Study Area:

The study area was the pavilion at the center of the Eau Claire Soccer Park, which is southeast of the intersection of Craig Road and W Hamilton Avenue (Photo 1 &2).  Weather conditions were beautiful, with light scattered clouds and a temperature of 57°F.  Record of the weather conditions may be found in the Field Notes section of this blog. 

Photo 1: Google Maps view showing area of interest at the Eau Claire Soccer park.
Photo 2: Ground view of the pavilion at the Eau Claire Soccer Park.  

Methods:

Both the Iris and the Phantom drones were used during this exercise.  The Iris was programmed using the "Structure Scan" mode on the mission planner tablet app to make circular paths around the pavilion starting at 5m and climbing to 26m at 4m intervals.  The GoPro camera on the Iris was set to the "narrow" lens view, and programmed to take a photo every 2 seconds.  After the Iris completed the mission, the drone was flown in manual mode at a height of approximately 2.5m above the ground to ensure that the entire building was captured by the drone.  

In comparison, the Phantom was used solely in manual mode, and each member of the class was given an opportunity to take photos of the pavilion by circling drone around the building.  Photos were taken using a variety of angles and heights to ensure full coverage.  

Oblique photography data collection for 3D modeling is different than Nadir (mapping) because shadows and the number of angles play a major role in how much detail is captured about the object being modeled.  For that reason, multiple photos of the same spot must be taken at different angles and locations to ensure that the model can be rendered in the proper detail.  In addition, more photos are needed (relative to nadir photography) because oblique photography tends to have high scale variations and radial distortions.

Discussion:

Data for this lab is not yet processed, so discussion will focus on the data collection experience.

During the data collection portion, I found oblique photography to be much more complex because many more variables are involved.  In Nadir photography, the camera angle and height above the ground is fixed, whereas in oblique photography both aspects are altered.  As a result, it may not always be practical to fly pre-planned missions where the camera shutter is set at a specific interval. For example, as seen in photo 2, the pavilion has an overhang that covers part of the lower building.  For this reason, the Iris was flown manually at 2.5m off the ground because it was believed that the original mission flown by the Iris (starting at 5m) was unable to capture the lower part of the building covered by the overhang.  The object chosen for 3D modeling in this lab is relatively simple, however it is easy to see how a more complex structure could require precise angles, and therefore manual mode, to prevent gaps in the data. 

Conclusion:

Oblique aerial photography captures objects at an angle, giving viewers a 3D representation  of an object that is easier to identify than nadir photography.  However, oblique photography should not be used for mapping or measurements because it has a larger degree of distortion that prevent applying the traditional nadir mapping equations.  Full coverage is important in order to obtain a complete rendering of the target object, meaning using mission planner or similar software may not be applicable in situations that require a more delicate touch.  Lastly, oblique photography requires more photos over a smaller areas because variables such as shadows and camera angles are no longer fixed.  


Monday, October 5, 2015

Lab 4: Gathering Ground Control Points


Introduction:


The purpose of this lab was to learn how to establish ground control points (GCPs).  GCP's are used to georeference and geometrically correct images taken from unmanned aerial systems.  Therefore, the accuracy of the map is only as good as the accuracy and precision of the GPS used to establish the position of a given GCP.  In this lab, obtained the location of the GCP's using various GPS platforms so that a comparison in their accuracy could be assessed.  A minimum of three GCP's is necessary to adjust an image to a reference coordinate system but in general, the more topographically variable a location is, the more GCP's that will be required (Aber, J.S., Marzolff, I., and Ries, J.B., 2010, 124-128). Lastly, when placing GCP's, it is important to ensure that the GCP's are spaced out and not at the edge of the map area.  This is because the further you get from the center of the map area, the more distorted the map features become.


Map Area:


Photo 1: Map area outlined by yellow rectangle.  Map area is located between Fairfax Street and Hester Street, just south of South Middle School.  


Photo 2:  Ground view of map area taken from the cul de sac at the end of Hester Street. 

Conditions during the lab period were Sunny/Cloudless, and a temperature of about 60°F. Documentation of the weather conditions in addition to a hand drawn map may be found under the field notes section of this Blog.

Methods:


Before a mission could be flown using the Matrix Quad Copter, ground control points were established on the ground.  Based on the size of the map area and relatively flat topography, six ground control points were established (GCP locations visually represented on hand drawn map under Field Notes section of blog).  The GCP's consist of a black and white tarp approximately one meter wide and one meter long so that they can be seen from aerial photo (Photo 3).  As each point was established, the location was taken using the Dual Frequency Survey Grade GPS.  This device has millimeter accuracy, and served as the baseline for the other GPS devices to be compared to.  
Photo 3:  Using the Dual Frequency Survey Grade GPS to pinpoint Ground Control Point locations.  

Once the GCP locations had been pinpointed using the Dual Frequency Survey Grade GPS ($12,000), the latitude and longitude were taken again using the following devices: Bad Elf GNSS Surveyor GPS ($600 and claims sub-meter accuracy), Bad Elf GPS ($125), Garmin GPS ($100), and a Smart Phone GPS.


The final objective of this lab was to fly a mission over the map area, so that the images could later be georeferenced using data from the different GPS's listed above.  As shown in photo 4 and 5, a mission was planned using the mission planner software, and executed using the Matrix Quad Copter.  
Photo 4:  Showing the mission created
using the mission planner software
Photo 5: Showing the Matrix Mid Fligh


Discussion:  


The data obtained from this lab is not yet processed, so the discussion shall focus on the GCP's and different GPS's used.

In a commercial setting, it is easy to see how the Dual Frequency Survey GPS would be necessary for certain projects requiring the the most accuracy.  However, not all people an afford $12,000 equipment to do their mapping.  This is why technology is moving toward a more portable option such as the Bad Elf Surveyor.  Although the Dual Frequency Survey GPS provides high quality data, it is rather large, and may pose mobilization issues when collected data from areas with difficult terrain.  Therefore, in some circumstances it may be more practical to utilize more compact equipment such as the Bad Elf GNSS Surveyor if the results defend its claim to sub-meter accuracy.  Using the Bad Elf GPS (Photo 5) with the Tablet made data collection very quick and easy, and was by far more portable than the Dual Frequency Survey GPS.
Photo 5, Showing the compact shell of the Bad Elf GPS

Lastly, Ground control points could become less practical if the mapping area is covered by heavy foliage, and is extremely large.  As learned from the lab, establishing GCP's takes a substantial amount of time.  If the same process is scaled up to large area with tough terrain and foliage, the process would prove extraordinarily time consuming.  

Conclusion:


This lab taught me which factors to consider when placing Ground Control Points so that the aerial photos could be properly georeferenced when processed. Overall, we placed six GCP's around the map area, and made sure to pick locations equally spaced from each other, away from the edges, and on varying levels of topography.  In addition, it was interesting to explore the strengths and weakness of each GPS device, and I am interested in analyzing data obtained from the Matrix Quad Copter.