Tuesday, November 17, 2015

Lab 11: Adding GCP's to Pix4D Software

Introduction:

Ground control points are necessary for the geometric correction of images, which improves the accuracy of the maps derived from aerial images.  The degree of accuracy and precision in which data are improved is therefore dependent on the accuracy and precision of the device used to establish the coordinates of the designated GCP locations on the ground.  The purpose of this lab is not only to demonstrate the consequences of not using GCP's, but also to show the importance of using high quality GPS units when establishing the points.  Pix4D software allows an individual to upload Ground Control Points, georeference the imagery, and generate an orthomosaic according to the adjusted tie points.  To accommodate for situations in which a user may or may not know the geolocation or coordinate system of the imagery/GCPs, there are three methods that GCP's can be added to Pix4D.

The first method is only used when the image and GCP geolocation and coordinate system is known.  To perform this method, add GCP data with the GCP/Manual Tie Point manager and run the first step to complete initialization, Next, mark the GCP's with the rayCloud so that the imagery is pinned to the proper coordinate.  Lastly, run steps 2 and 3 to generate an orthomosaic.

The second method may be used if the initial images are without geolocation, or when either the initial images or GCPs are in a local coordinate system.  To perform this method, run step 1 before adding and marking three of the GCPs in the rayCloud.  Then, add and mark  the other GCPs with the Manual Tie Point Manager and rayCloud editor, respectively, before running Steps 2 and 3 to generate the DSM and Orthomosaic.

The last method may be used for any situation, but requires more time in order to mark the GCPs on the images.  To perform this method, add and mark all GCP's with the Basic GCP/Manual Tie Point manager and run steps 1, 2, and 3.

Study Area:

Photo 1: Map area outlined by yellow rectangle.  Map area is located between 
Fairfax Street (East of baseball fields) and Hester Street (northwest corner of the map), 
just south of South Middle School.  

Data collected on September 30, 2015. Weather conditions upon data collection: Sunny/Cloudless, and a temperature of about 60°F. 

Methods:

For this Lab, photos obtained from the SX260 camera were uploaded to the software using the new project wizard on the welcome page.  The image geolocation and GCP coordinate system is known, so method 1 was used to process the data.  Because this specific camera contains a GPS unit, the geographic locations of each photo are stored with the image and the program is able to automatically detect the coordinate system and camera information. Before finishing the new project wizard, it is important to indicate that the exported data should be in the UTM NAD 1983 Zone 15 coordinate system so that the imagery aligns with the GCP data.  Next, a text file containing the latitude and longitude of each ground control point was imported to Pix4D using the "GCP/Manual Tie Point Editor" tool (Photo 2).  Using the "rayCloud Editor", tie points may be adjusted by pinning the GCP coordinates to the center of the GCP in each image (Photo 3).  The more images that are adjusted, the more accurate/precise the overall data will be.  For the purpose of this lab, at least ten images were adjusted for each GCP.

Photo 2: Displaying the GCP/Manual Tie Point Manager. The green number
on the left side of each row indicates the number of images adjusted to the X,Y
Coordinates.  Key functions of this window include the "Import GCP" button on the
upper right hand  corner, and the "rayCloud Editor" on the
lower left corner.
Photo 3: Displaying the rayCloud Editor window within the Tie Point Manager.
The lower right window of the editor populates all the images containing the designated
 GCP, and allows the user to pinning the coordinates to the image by clicking on the
center of the ground control point

After using the rayCloud editor to align images to the GCP coordinates, the data was processed to produce a georeferenced orthomosaic.  For the sake of demonstrating the importance of utilizing GCPs, an orthomosaic was generated without using the GCP data for comparison. The processing reports are linked below, and provide indication of the amount of geolocation error, amount of overlap, and number of images processed.  

Results/Discussion:

Comparison Between GCP and Non-GCP Orthomosaics

Results from the orthomosaics generated with and without the GCP points are shown in Photo 4 and 5, respectively.  Visually, it is quite obvious that the imagery processed with the GCP's is far more accurate, and aligns far better to the basemap than the imagery processed without the GCP's. It may be seen from photo 5 that the ground GPS units indicate that the imagery is substantially pulled northwest of the actual GCP locations.   This is likely a result of the poor quality GPS in the SX260 camera which is unable to provide the precision required for high quality and survey grade maps.  

Photo 5: Showing the SX260 imagery not
corrected
using ground control points. Satellite
base imagery shown for comparison.The GCP
numbers follow a counter clock-wise order
starting at the cars in the northwest corner (1). 

Photo 4: Showing the SX260 imagery corrected
using
 ground control points in Pix4D. Satellite
base imagery shown for comparison.  The GCP
numbers follow a counter clock-wise order
starting at the cars in the northwest corner (1).


All images taken on September 30th, 2015 at the Southside Community Gardens in Eau Claire, WI 
with a SX260 Camera for the purpose of learning how to input Ground 
Control Points in Pix4D software.  


An analytical representation of the error is possible by calculating the root mean square (RMS) for each transformation performed.  The RMS equation uses residuals, which is the measure of the difference between locations that are known and the the locations that have been digitized, to give an indication of how accurate the derived transformation is.  ArcGIS automatically displays the RMS value when using the georeferencing tool to translate points from the "Non-GCP Orhomosaic" to GCP Orthomosaic (Photo 6). 
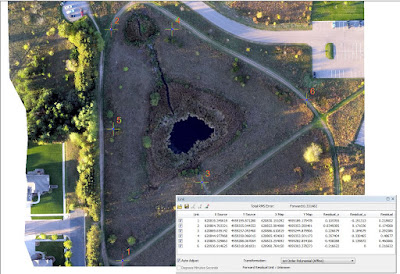
Photo 6: Showing the georeferencing function and the resulting RMS calculation
 (upper right hand corner of  grey box).  

Comparison of Ground GPS Units

It was assumed that the Dual Frequency Survey Grade GPS is the most accurate, and the coordinates obtained from the device were used to pin the GCP's to the image in Pix4D. The Dual Frequency Survey Grade GPS is represented as a red circle the photo, and lies directly over each GCP.  Comparatively, the iphone Collector was unsurprisingly very unreliable.  Although it occasionally came very close to the actual mark (as in the case of GCP 2), other locations show it to be the most inaccurate unit (GCP 5 and 6).  With regards to the Bad Elf Survey Collector, I was surprised to see that two of the points (GCP 1 and 4) were way off point while the rest of the points were fairly accurate. Regardless, the Bad Elf Surveyor proved incapable of living up to their claim that it provides accuracy within 1m (Photo 7). Overall, the other GPS units appeared to have relatively the same amount error and variation between points, with the Garmin GPS being the most consistent device.  
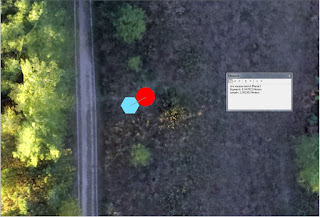

Photo 7: Measuring the distance between the Dual Frequency Survey Grade
GPS (Red Circle), and the Bade Elf Surveyor (Blue Hexagon) at GCP 2.
The error at this GCP is over 2.5m.  

Software Discussion:

Adding GCP information to the imagery is easy and intuitive with the use of Pix4D software. I found that when pinning the UTM GCP coordinates to the images, the ability for the program to recognize and populate images saved an enormous amount of time.  However, if the user is unaware of what the program is doing, it is easy to click through the various windows and select a different coordinate system for the imagery than the GCP's.  Using two different coordinate systems is possible, but not recommended because this will result in completely useless data. 

Although this lab has proven the importance of using GCP's in aerial photography, it does have its limitations.  One major struggle in this lab was simply processing the data because it took between 2-3 hours to generate each orthomosaic.  In the real world, it may prove difficult to perform the data analysis if a company does not have access to the appropriate computer processing power.  Furthermore, the resolution of the data combined with the GPS data sets made this project extremely hard to work with in ArcGIS because the program had to continually re-draw the raster data at each click of the mouse.

Conclusion:

Establishing GCP's is necessary in order to georeference data, even when a camera such as the SX260 has a GPS built into the system. Not all GPS systems are created equal, and therefore caution should be taken when selecting the device for a survey project.  Although the Dual Frequency Surveyor is the most accurate, it is also a large device, which makes it more cumbersome and time consuming to use in difficult terrains.  Overall, the accuracy of the GPS is directly related to the accuarcy of the end product.  Fortunately, Pix4D software makes it incredibly easy to add GCP data and adjust imagery to align to the correct coordinates.  

Tuesday, November 10, 2015

Lab 10- Construction of a point cloud data set, true orthomosaic, and digital surface model using Pix4D software.

Introduction:

Pix4D is powerful mapping program capable of converting images taken by drone to highly precise georeferenced maps, mosaics and 3D models. This program is unique compared to  other processing software (such as the GEMS software) used in previous labs because it has the power to orthorectify data using digital elevation models.  Pix4D also comes equipped with editing tools such as the rayCloud Editor, which combines the 3D point cloud and images to allow the user to assess the quality of their results (Photo 1).  Other tools such as the Mosaic Editor and the Index Calculator allows the user to improve the quality orthomosaics and generate NDVI vegetation maps, respectively.
Photo 1: Showing the densified point cloud from the RGB GEMS data set. 
 Green dots indicated where the drone is, and blue dots indicate
 where the drone should be at the time of the image capture.  Red dots indicate
 data that was discarded. 

Other aspects that separate Pix4D from other software packages is the its ability to process multiple flights and oblique images.  However, it is important to note that if the pilot is intending to process data from multiple flights, that he/she must ensure enough overlap between images, and that the two flights are conducted under as similar conditions as possible (sun direction, weather, no new objects, etc.). Similarly, when constructing an image acquisition plan for reconstruction 3D buildings, it is important for the pilot to take one image every 5-10 degrees to ensure enough overlap for processing in Pix4D.  Additionally, it is important to note that Pix4dmapper only generates a point cloud for oblique images, and does not produce an orthomosaic.  

Study Area:

Data were obtained at the Eau Claire Soccer fields southeast of the intersection of Craig Rd and Hamilton Avenue in Eau Claire Wisconsin on September 23rd, 2015. Weather conditions during data collection were Mostly Cloudy-Overcast,72°F, and the wind speed 5-8 mph from the southeast.  
Photo 2: Base map of study area obtained from ArcMap GIS 10.3.1

Methods:

Pix4D integrates an extremely user friendly interface and performs most functions at a click of a button.  For this Lab, photos obtained from the SX260 camera were uploaded to the software using the new project wizard on the welcome page (Photo 3).  Because this specific camera contains a GPS unit, the geographic locations of each photo are stored with the image and the program is able to automatically detect the coordinate system and camera information.  Therefore, no additional settings were altered in the "new project" wizard.  Comparatively, the GEMS camera stores the geographic coordinate information separately from the image data as a text file (Photo 4).  However, before loading the txt file, it is important for the user to input the camera specs first (Photo 5).  After the camera information is loaded, load the txt file found within the original data collection folder so that the images may be georeferenced.


Photo 3: Displaying the uploaded photos in the
new project wizard.  
      
Photo 4: Txt. file
showing the GEMS images
and their associated
Latitude and Longitudes
Photo 5: Displaying the edit camera
menu within the new project wizard.
To add information for the GEMS
camera, RGB was selected under the
"Bands" drop down bar, focal length
was set as 7.7, and the sensor width was
set at 4.8.


After all necessary information is entered, it is crucial to double check that the latitude and longitude of the images are in the ball park of what is expected. If all information is accurate, finish the new project wizard and run the data analysis of the images to create a digital surface model, point cloud data set, and orthomosaic.

Pix4D generates a data quality report after analysis to provide the user with information regarding the number photos calibrated and georeferenced, the amount of overlap, and geolocation error.  Links to the quality reports from this lab are posted directly below:

SX260 Quality Report (Link)

Photo 6: Calculating volume of shelter
from SX260 camera data set. Edges of the
shelter are highly pixelated, making it
 difficult to capture the full shelter volume.
The SX260 data set is much smaller than the GEMS data set, but the quality report shows that 32 out of 32 total images were processed and referenced.  Due to the lack of images, the number of overlapping images averages around 3-4.  Problems occurred when attempting to calculate volume in Pix4D for this data set because pixel resolution was too poor to capture the full volume of the shelter (Photo 6). To improve the data set, images should be taken more frequently to increase the amount of overlap. Video 1 shows the SX260 data as it is represented in Pix4D.


GEMS Quality Report (Link)

Pix4D processed 215 of the 220 images for the GEMS data and geolocated 219 of the 220.  As represented under the computed Image/GCPs/Manual Tie Points Positions heading, the only images discarded were those taken directly after the roto-copter took off from the ground. The remaining photos were properly processed, and had a high average number of overlapping images (5+).  The quality report shows that areas that only have three overlapping images or less are located predominately at the edges of the map area, as expected. Overall, the quality of this data set is extremely good.  Video 2 shows the GEMS data as it is represented in Pix4D


Post-processing geometric calcuations

Calculating length of polylines, areas, and volumes using Pix4D is relatively simple due to the tools integrated into the software.  After drawing the line or polygon in the rayCloud editing tab of Pix4D, the software will automatically determine the length, area, or volume (Photo 7).  
Photo 7: Displaying the surface area calculation of one of the
soccer fields at the Eau Claire Soccer park. 


Results/Discussion:

The data obtained from this lab may be utilized/analyzed using a number of different methods. One objective of this lab was to learn how to calculate distances, surface areas, and volumes of aerial images.  The calculated lengths, areas, and volumes of the objects measured (The shelter as shown in photo 6 and the soccer field in photo 7) are represented in table 1 and represented visually on the maps in photo 8. 

GEMS
Bike Rack Polyline (length):2.77m
Soccer Field Area:327.29m2
Shelter Volume:6.48m3
SX260
Sidewalk Square Polyline (length):2.64m
Soccer Field Area:323.74m2
Shelter Volume:8.13m3
Table 1: Lists the measured objects and their associated calculated 
length, area or volume. The bike racks were not shown in the SX260
data within Pix4D, so the length of one sidewalk square was 
measured instead.  

Photo 8: Comparing final maps between the GEMS and SX260 Cameras. 
All images taken on September 23rd, 2015 at the Eau Claire Soccer Fields 
with a GEMS and SX260 Camera for the purpose of learning how to capture 
aerial field data and process it using Pix4D software. Cartographer Nick Matula


The results from table 1 show that there are some differences between calculations. The soccer field areas differed by approximately 3.5 meters squared, and the volume of the shelter differed by 1.5 meters cubed.  These differences may be accounted for by the differences in data quality.  The GEMS data set had a substantially larger number of images, which allowed Pix4D to more accurately line up features within each image. It is important to note that the DSM images are also very different from each other.  In the SX260 DSM, the main pavilion is not shown as having the highest elevation, which further indicates to a weaker quality of data.  As a general rule, the recommended overlap for most cases is at least 75% frontal overlap (with respect to the flight direction) and at least 60% side overlap.  However, when the study area is a uniform field or covered by snow, 85% frontal overlap and 70% side overlap is recommended.  It is suggested therefore, that in the future that images are taken more frequently for fuller coverage.  Although more data will result in longer processing times, it is necessary in order to obtain reliable data from volume calculations.


One aspect of the Pix4D that raises concern is that it is almost too intuitive.  As a result, an unsuspecting user that doesn't know what is going on can easily end up with inaccurate results.  For example, when georeferencing the GEMS images it was important to look at the order that the latitude and longitude were recorded and stored in the .txt file.  Instead of listing the latitude first and the longitude second, the order of the values are switched.  It is easy to assume that the program will correct the problem itself, but in reality it is necessary to tell the program the data from the .txt file is listed in the reverse order so that the images are referenced properly.  Without having a general idea what the latitude and longitude should be in a target area, an unsuspecting user could easily georeference the images backwards and result in improperly located data.

The applications for aerial photography volumetrics is enormous in the mining industry.  Specifically in sand mining, the size of storage piles are regulated by the DNR.  Currently, surface area is being calculated using time consuming traditional survey techniques.  With aerial photography and processing software such as Pix4D, storage pile volumes and surface areas could not only be calculated more efficiently, but also then used to show growth/decline of product reserves over time.  Furthermore, aerial technology could also be used to assist reclamation by calculating excavated volumes and the area of lands environmentally disturbed by mining processes.

Conclusion:

Pix4D is a dynamic program of producing orthomosaics and calculating distances, surface areas, and volumes of objects.  One strength of Pix4D is that it is extremely user friendly, and simplifies the process of georeferencing and inputting camera specifications if it is not stored with the images. If processing images without geolocation, ground control points should be used so that scale, orientation, and absolute position may obtained in the Pix4D software.  Without geolocation, the data is unable to be used for mining, agriculture, and other applications.

The data from the GEMS data averaged an image overlap of five images while the SX260 data averaged an average of three images.  The lack of overlap in the SX260 data effected the ability of Pix4D to calculate geometric accurately, and demonstrates the need to maintain at least 75% overlap of images. When high quality data is combined with an expansive analyst tool set, Pix4D becomes a powerful tool to process aerial photography.